All Projects
Back to HomeFilter by Technology
🔒 Confidential Client Excel Projects
Over 50 professional Excel dashboards, reports, and data models delivered to clients across HR, Finance, Marketing, and Operations — protected under strict NDAs and confidentiality agreements.
🔒 Confidential Client Power BI Projects
Over 10 professional Power BI dashboards and interactive reports delivered to clients across various industries — protected under strict NDAs and confidentiality agreements.
/1.png)
SGS - Mega-Event Operations & Hiring Automated Report (Client Project)
A centralized Excel data model aggregating massive volumes of operational and hiring data for the Hajj season, with automated PowerPoint integration for real-time executive reporting of charts, hiring progress, and budget KPIs.
SAR - Excel Automation Suite (Client Project)
Devised a 4-system Excel automation suite for SAR's engineering and operations teams. Built an ECR management system with Gantt chart timeline, automated overdue alerts, and developed systems for RCA tracking and asset task management.
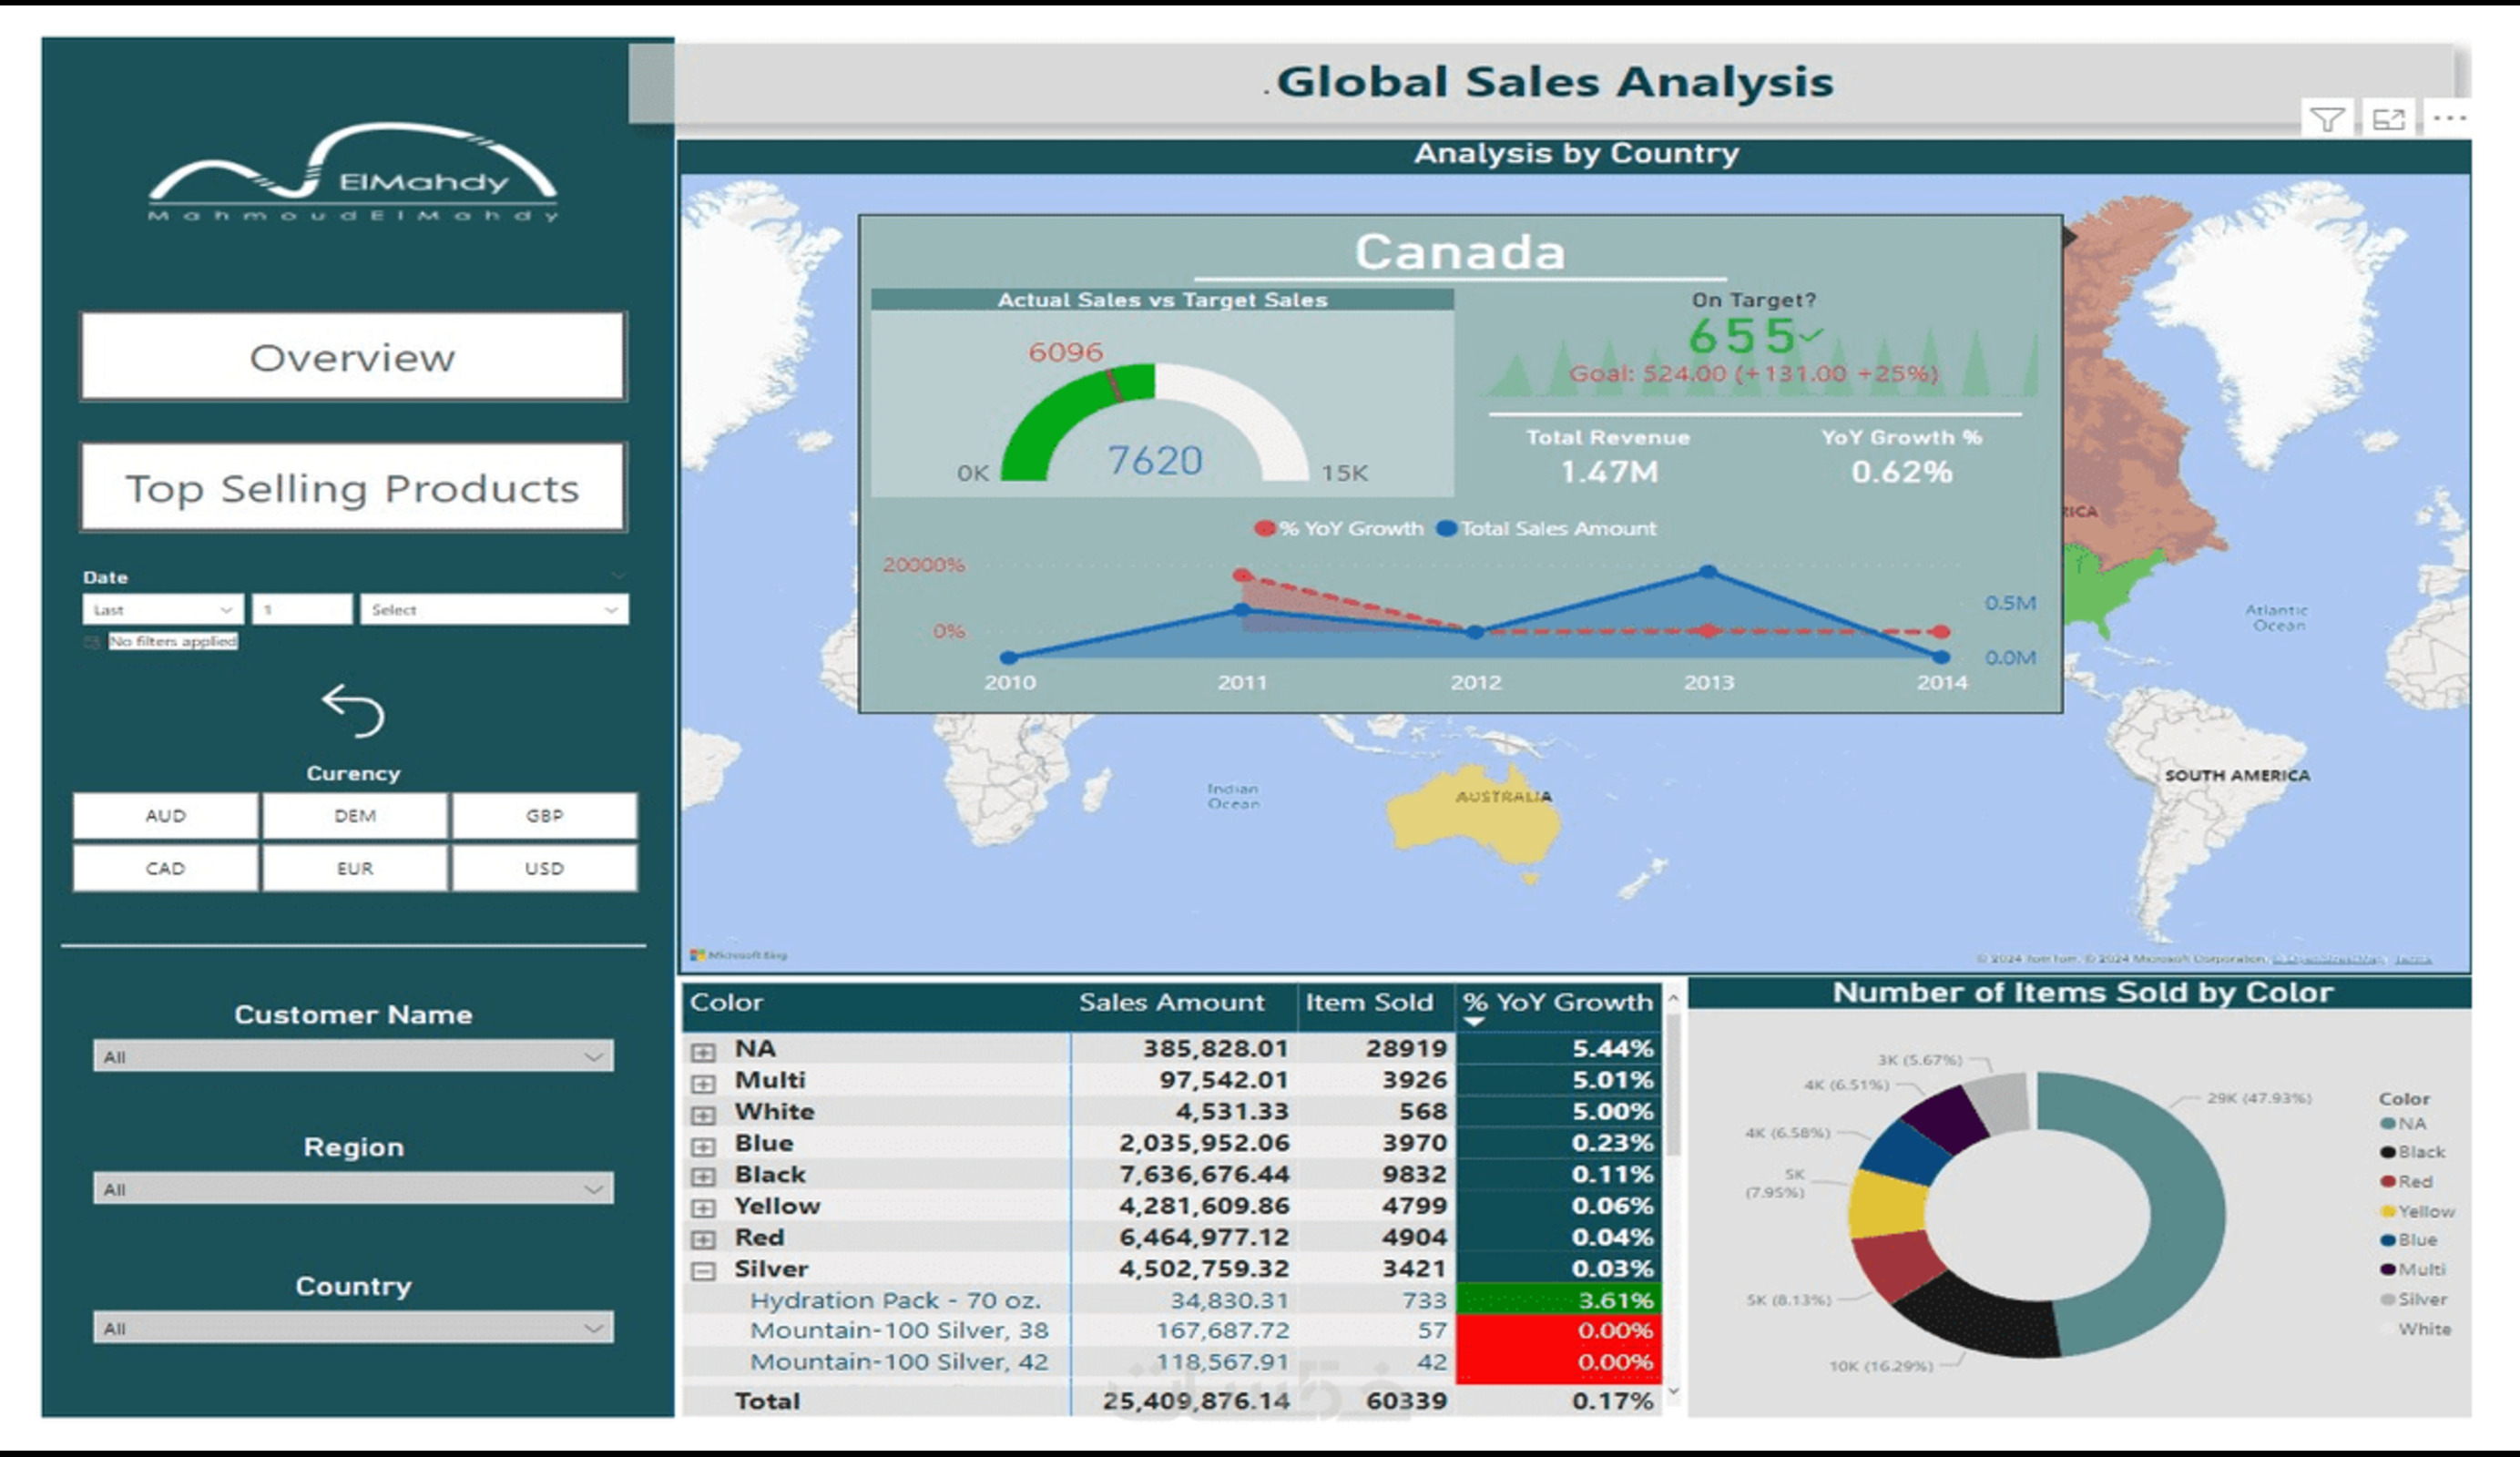
Sales Analytics Dashboard
Comprehensive sales performance dashboard featuring KPI tracking and trend analysis, allowing us to identify trends and determine which products are the most profitable.
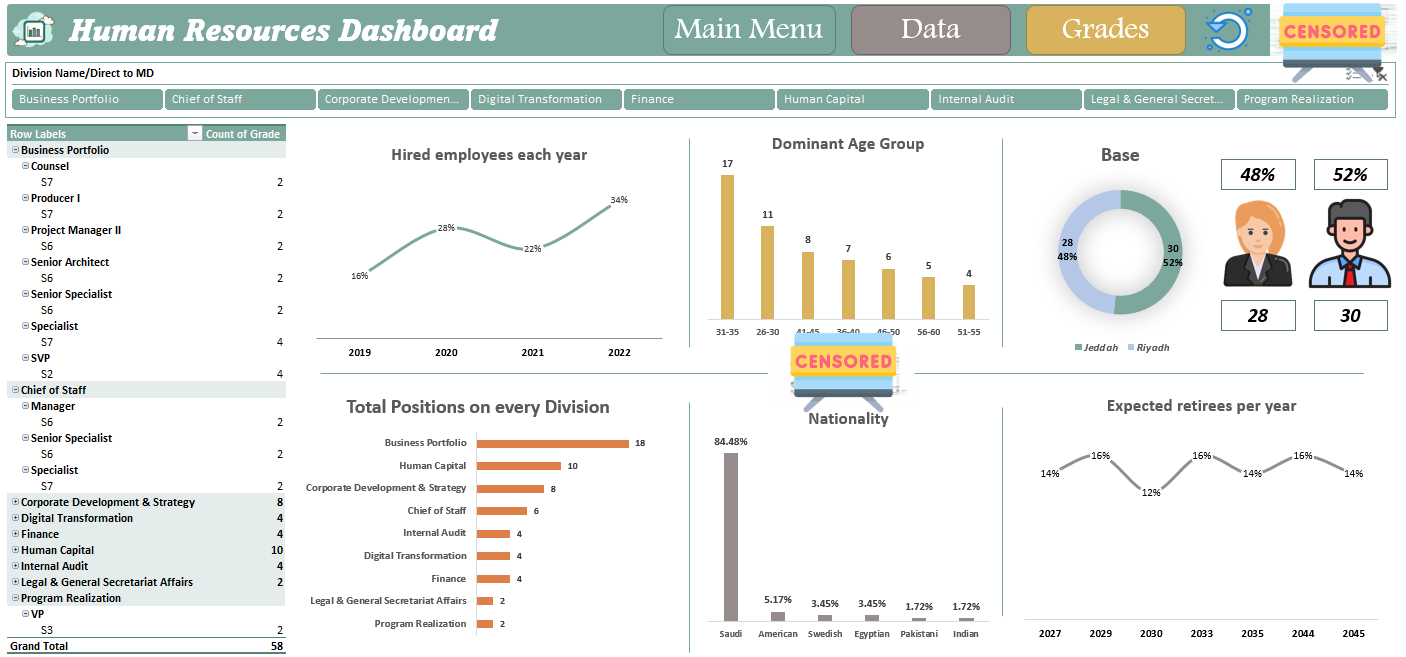
Enterprise HR Analytics & Workforce Planning Dashboard
A fully interactive Excel dashboard consolidating HR records with dynamic visualizations to track age dominance, nationality distribution, and geographic base. Includes a forecasting model to visualize expected retirees up to 2045.
/1.png)
Omnichannel Digital Marketing Dashboard (Client Project)
A comprehensive, multi-tab Excel dashboard consolidating fragmented marketing data (Google Ads, Social Media, SEO, and Blog) for a travel agency (Tourzable), with a cohesive dark mode UI for premium executive experience.
/1.png)
Automated Executive HR Reporting System (Excel to PowerPoint Integration)
A robust backend data model in Excel processing monthly HR metrics (Turnover, Localization, Payroll, Joiners/Leavers across 15+ divisions) with seamless, automated integration to PowerPoint for one-click executive reporting.
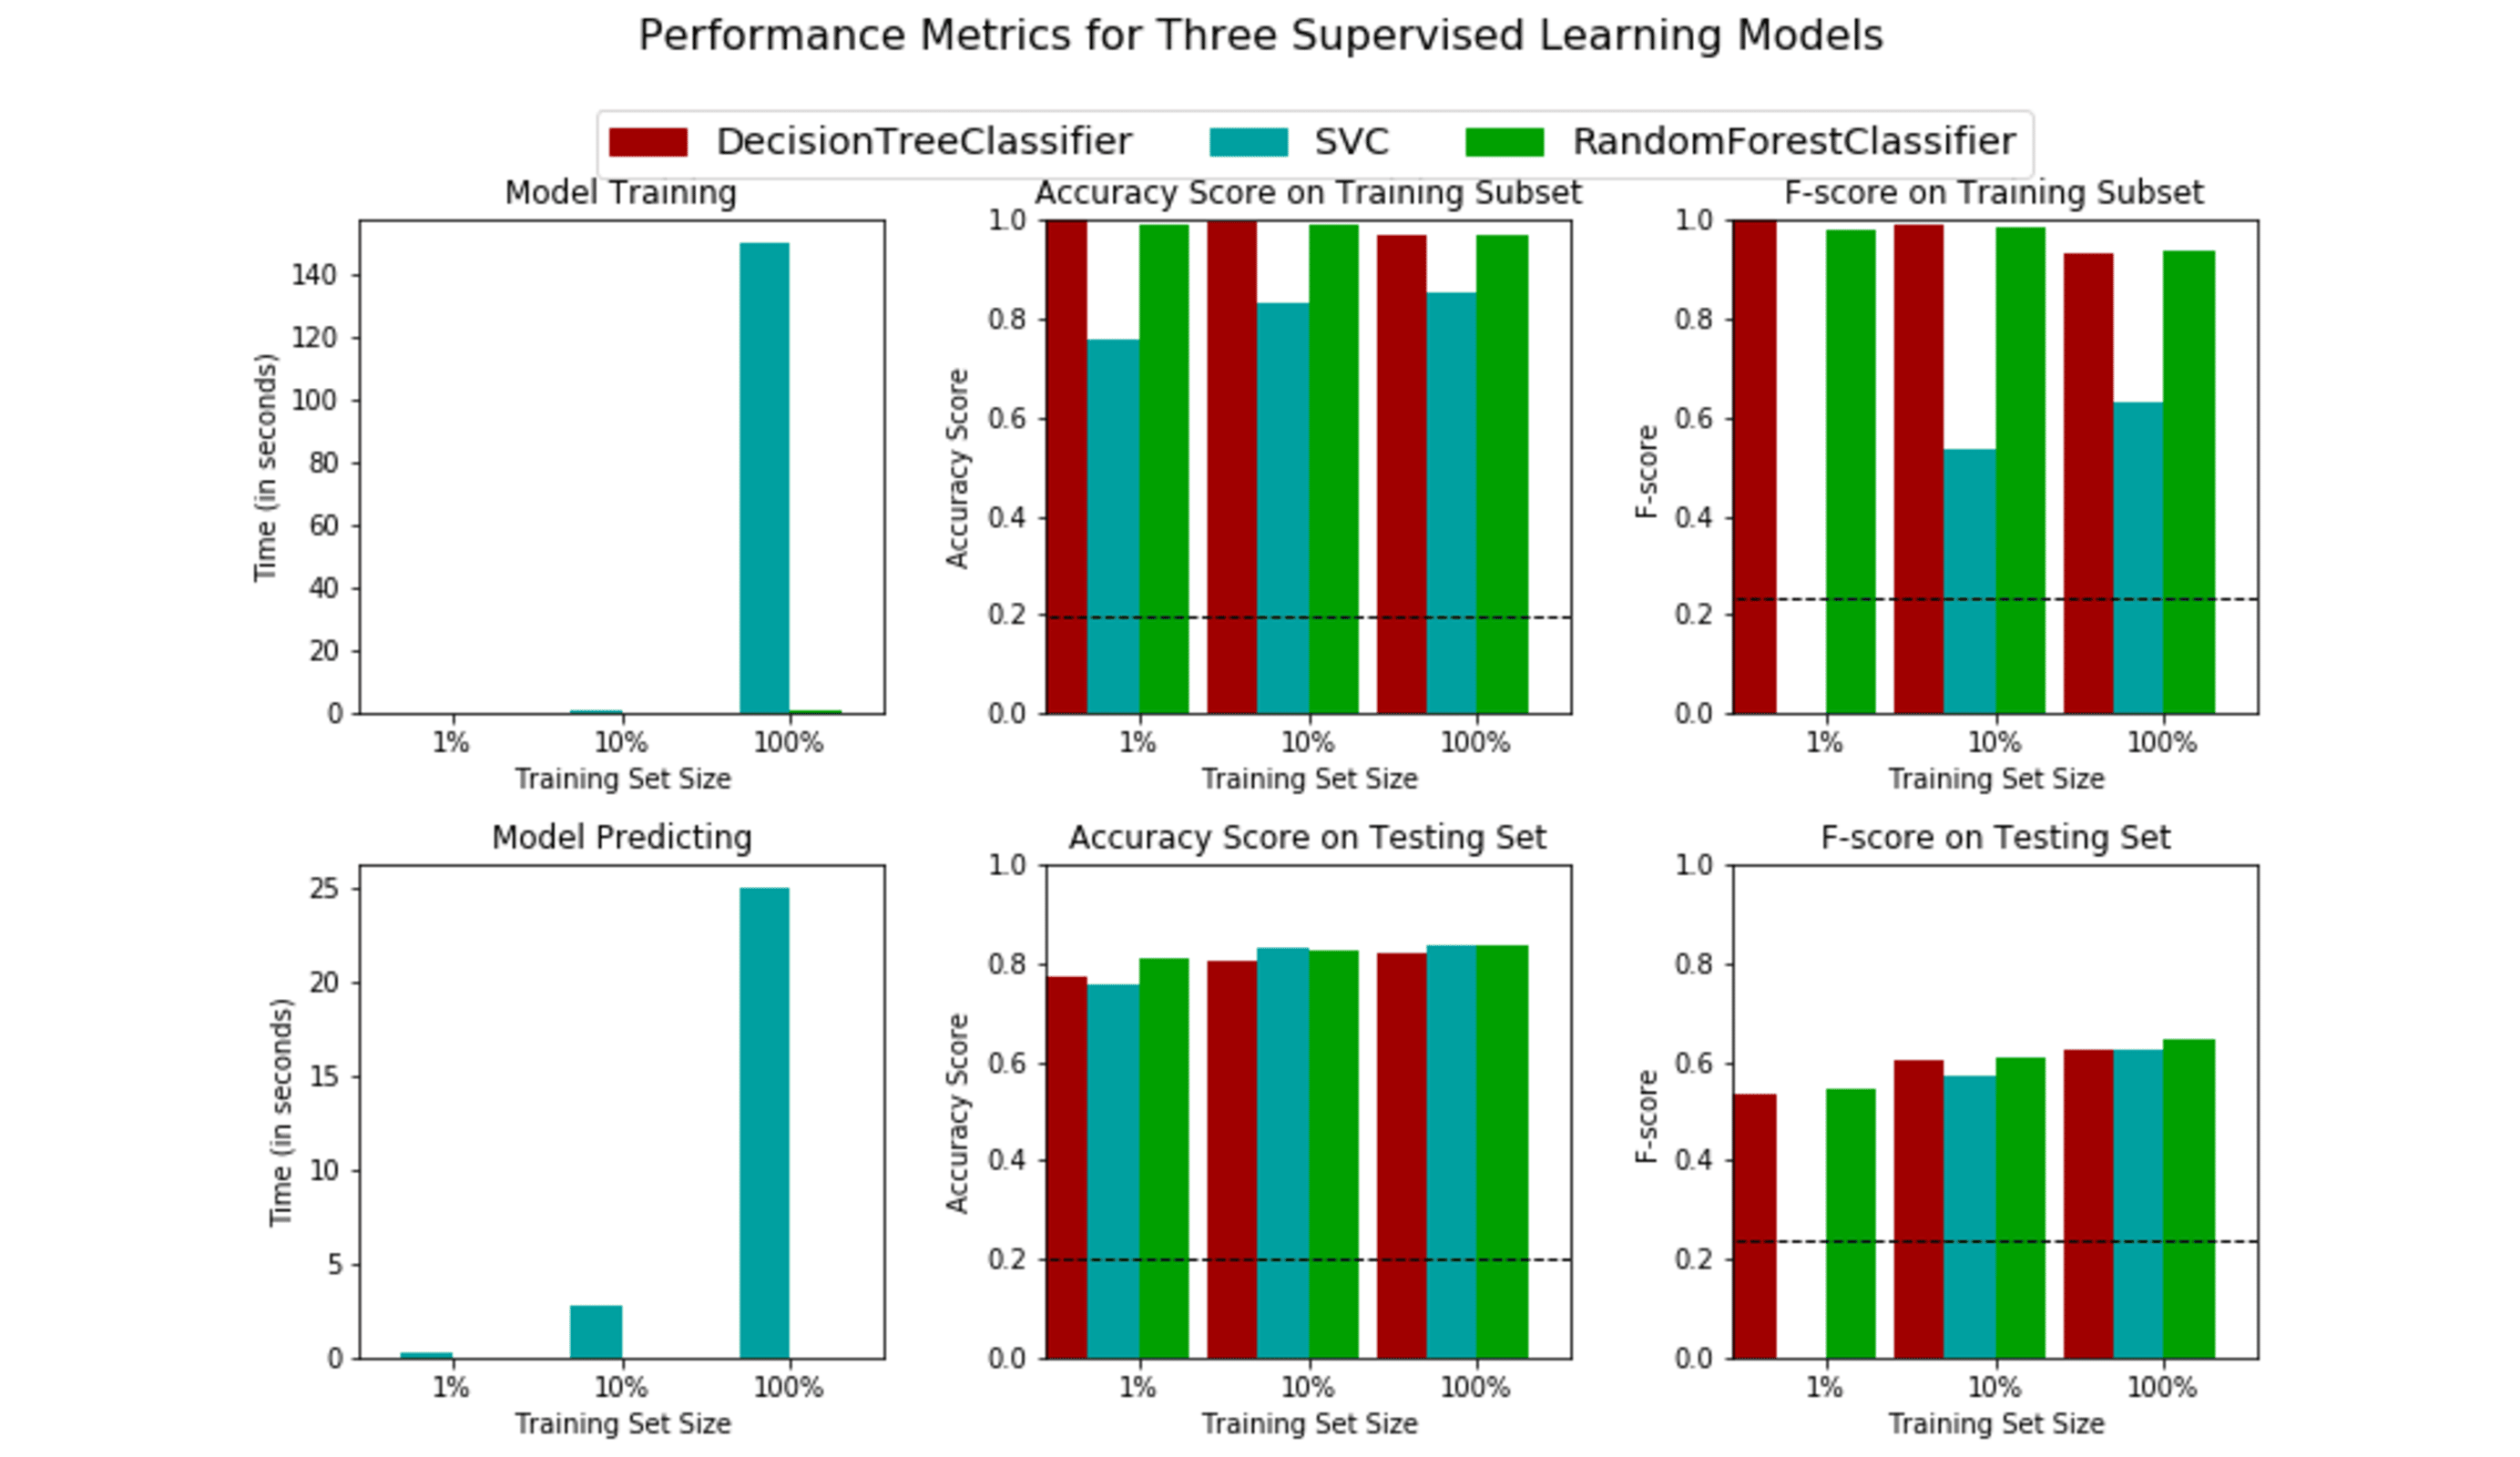
Finding Donors for Charity
This project involved a comparative analysis of supervised learning algorithms from the scikit-learn library. I developed a framework to evaluate and contrast the performance of various models, providing insights into their practical application and the critical skill of selecting the most suitable algorithm for a given machine learning task.
Data Warehouse and Analytics Project
Building a modern data warehouse with SQL Server using Medallion Architecture (Bronze, Silver, Gold layers). Includes ETL processes, data modeling, and analytics for customer behavior, product performance, and sales trends.
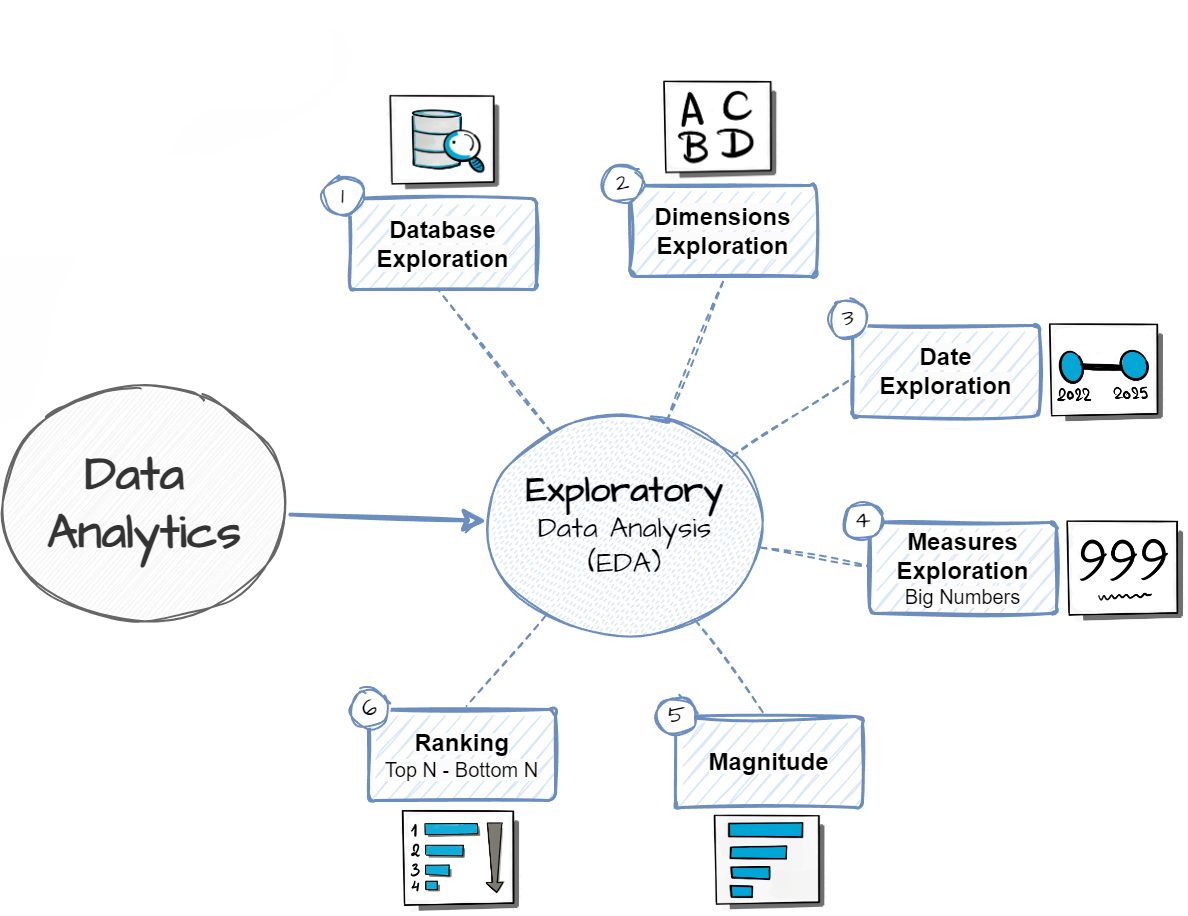
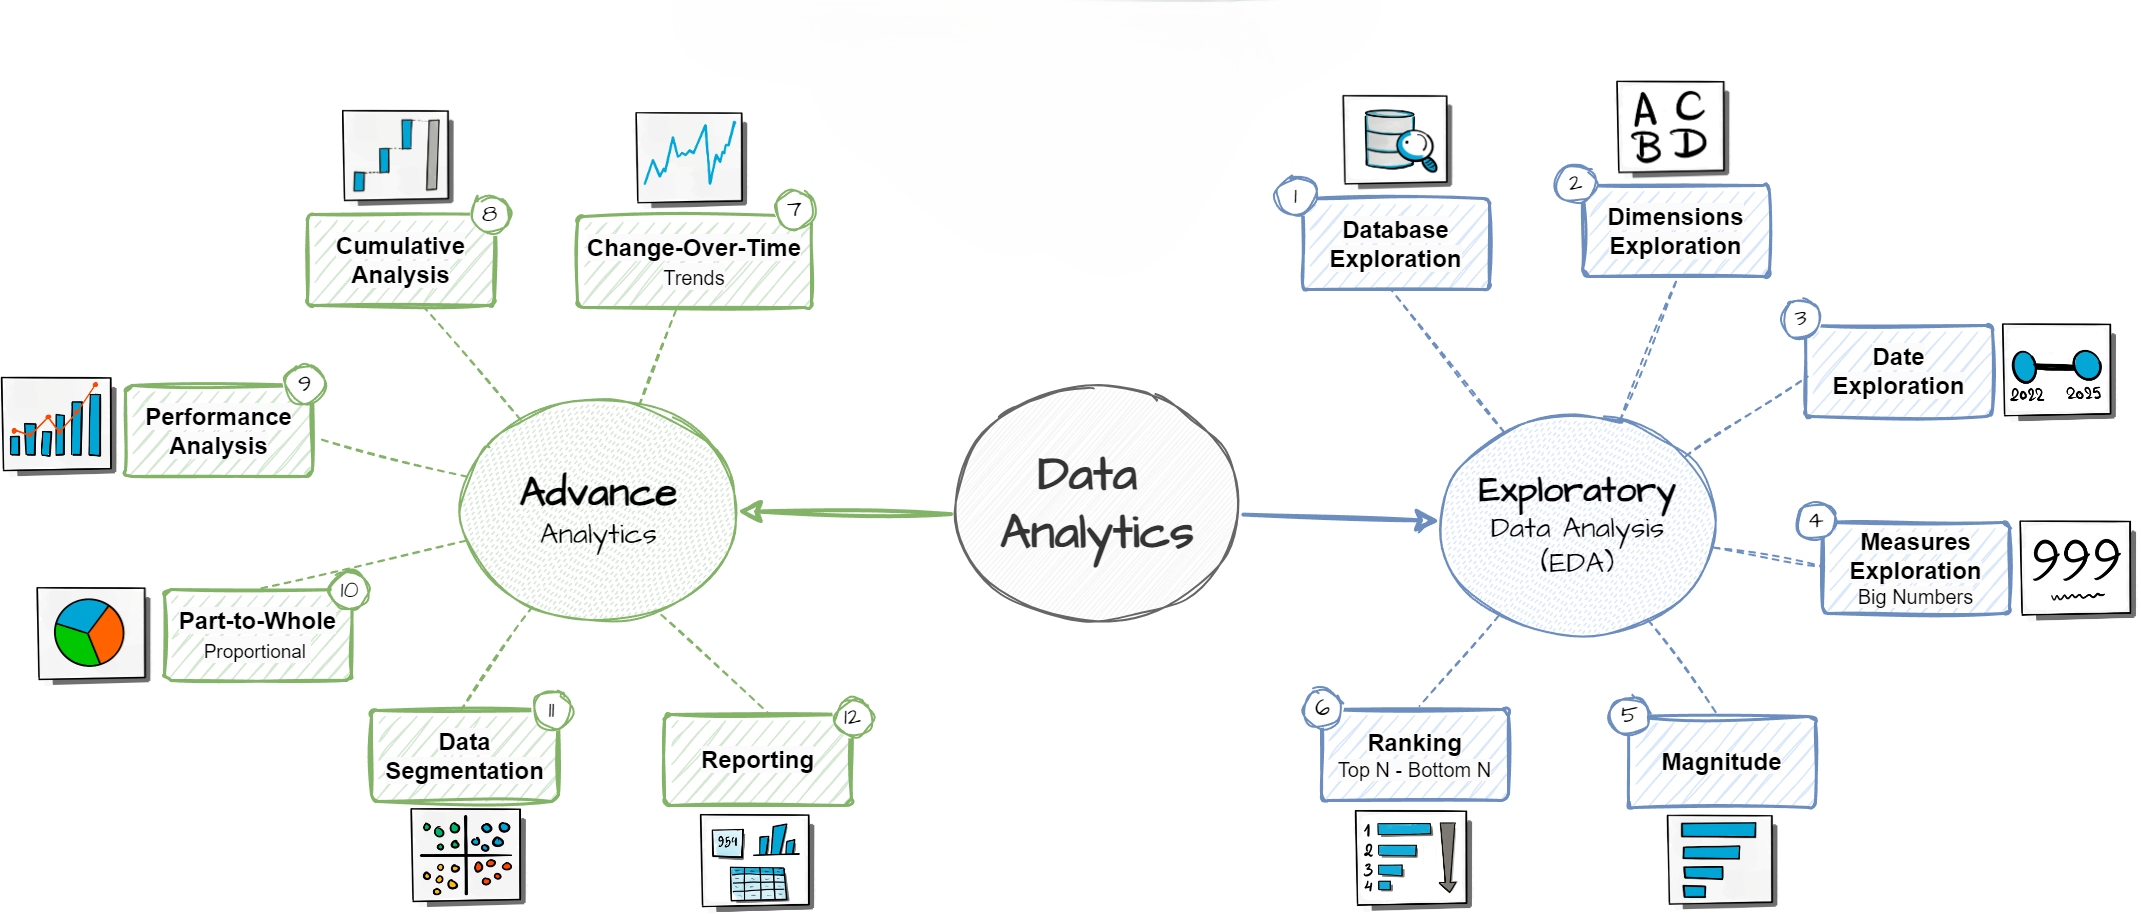
Bikes Market EDA
Exploratory data analysis on bikes market data to uncover trends, patterns, and insights. Analyzing market dynamics, pricing, and customer preferences using data analysis techniques.
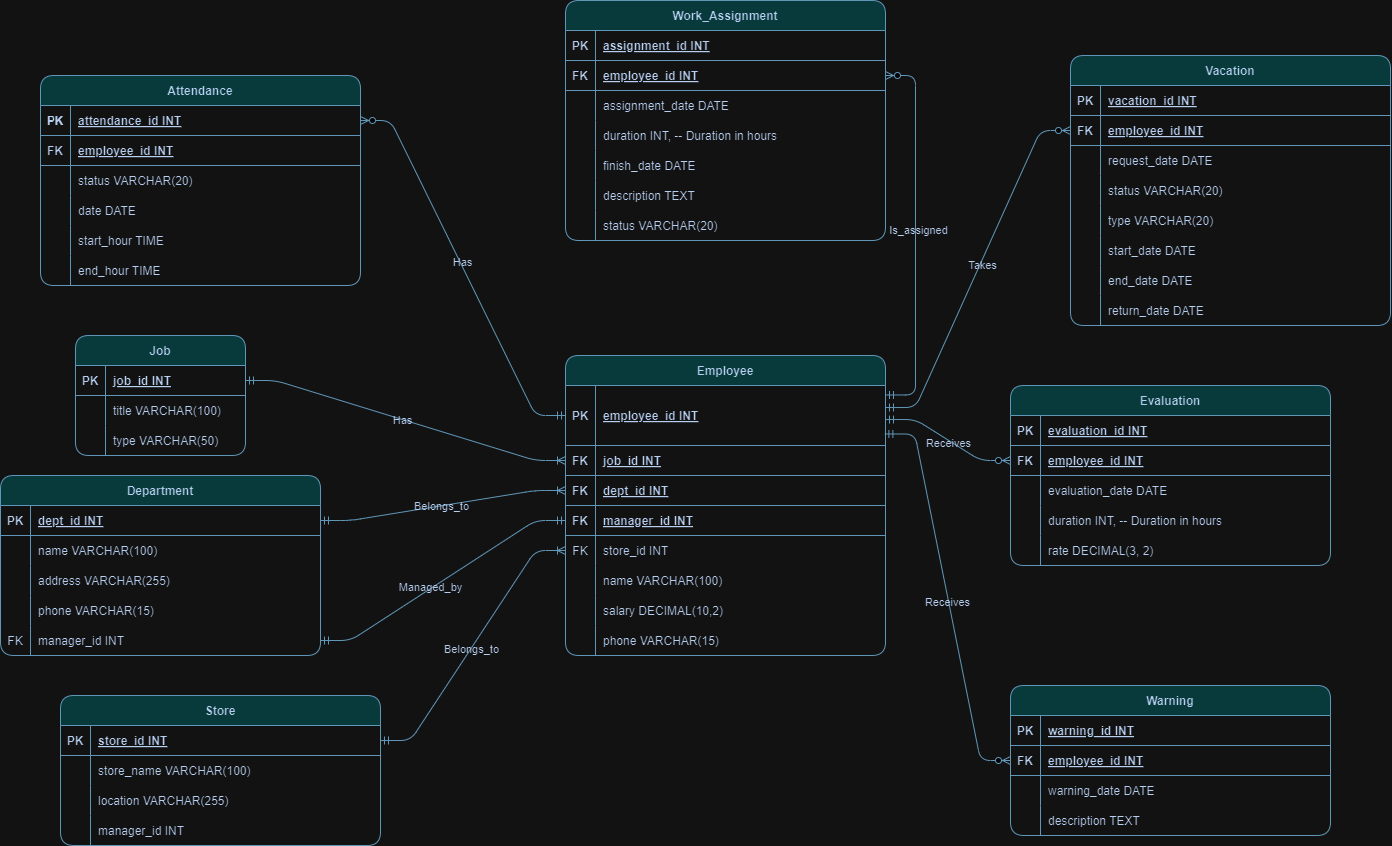
Database Management for Retail Chain
An HR management system designed to streamline workforce operations for a retail chain. The system manages the entire employee lifecycle—from records and attendance to evaluations and vacations—across multiple store locations.

Advanced SQL Mastery
A deep-dive into advanced SQL techniques — mastering window functions, recursive CTEs, correlated subqueries, and complex multi-table joins through hands-on exercises and real-world query challenges.

Bike-Share Statistical Analysis Engine
An object-oriented Python application that computes descriptive statistics on US bike-share systems — analyzing ridership patterns, popular stations, trip durations, and user demographics with an interactive CLI interface.

US Rental Market Intelligence
A data-driven analysis of the US apartment rental landscape — exploring pricing distributions, geographic trends, and key features influencing rent across multiple listing platforms to uncover actionable market insights.

COVID-19 Global Impact Data Exploration
An in-depth SQL exploration of global COVID-19 datasets — analyzing infection and mortality rates, vaccination progress, and regional comparisons to surface critical insights about the pandemic's worldwide impact.

Encryption and Decryption Python Project
Transposition Cipher algorithm implementation that can encrypt and decrypt messages using the transposition cipher—a simple yet effective way of encrypting text that becomes unreadable without the decryption key.

Bay Area Bike-Share Ridership Insights
A comprehensive exploratory data analysis of San Francisco's Ford GoBike system — visualizing trip distributions, rider demographics, peak commute patterns, and station popularity to reveal the behavioral dynamics behind urban micro-mobility.
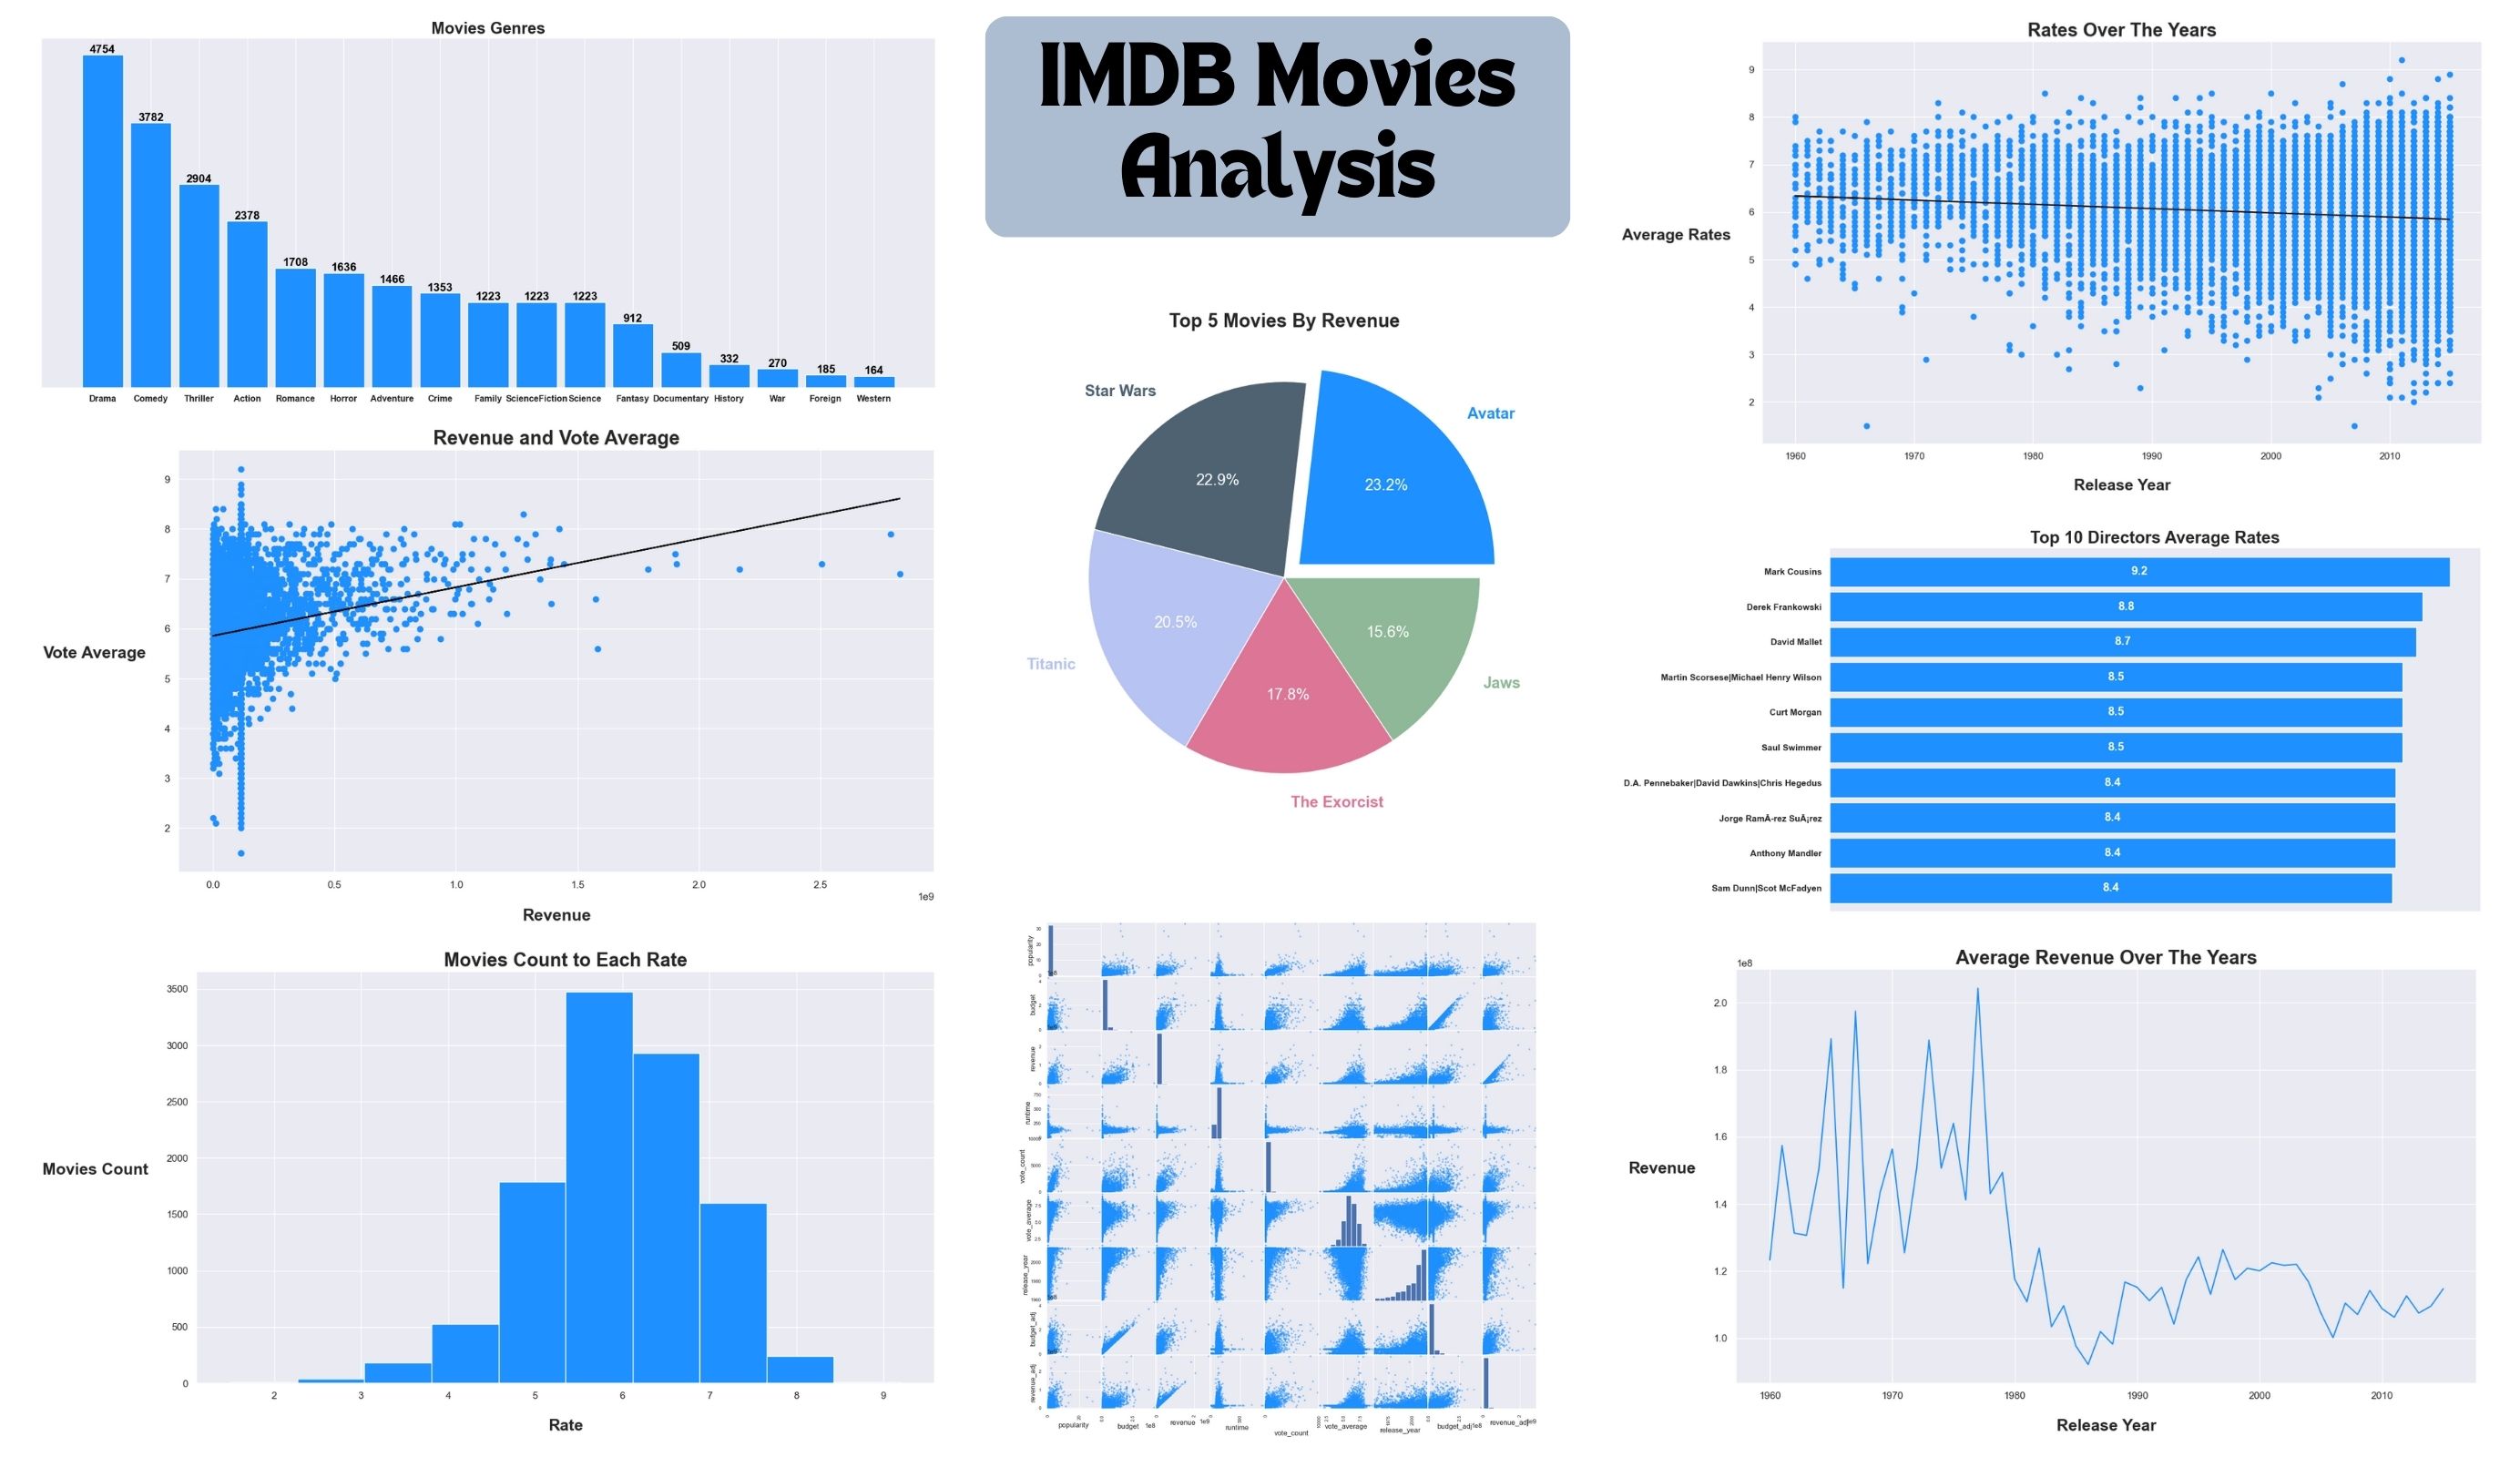
IMDB Data Analysis
Data analysis and visualization on IMDB database to answer the most frequently asked questions about movies using Python, Pandas, Matplotlib, Seaborn, NumPy, and Jupyter Notebook.

Stock Market Trading Simulator
A gamified stock trading experience built with Unity and C# — players learn investment fundamentals, portfolio management, and market dynamics through an interactive simulation with real-time price fluctuations and risk scenarios.
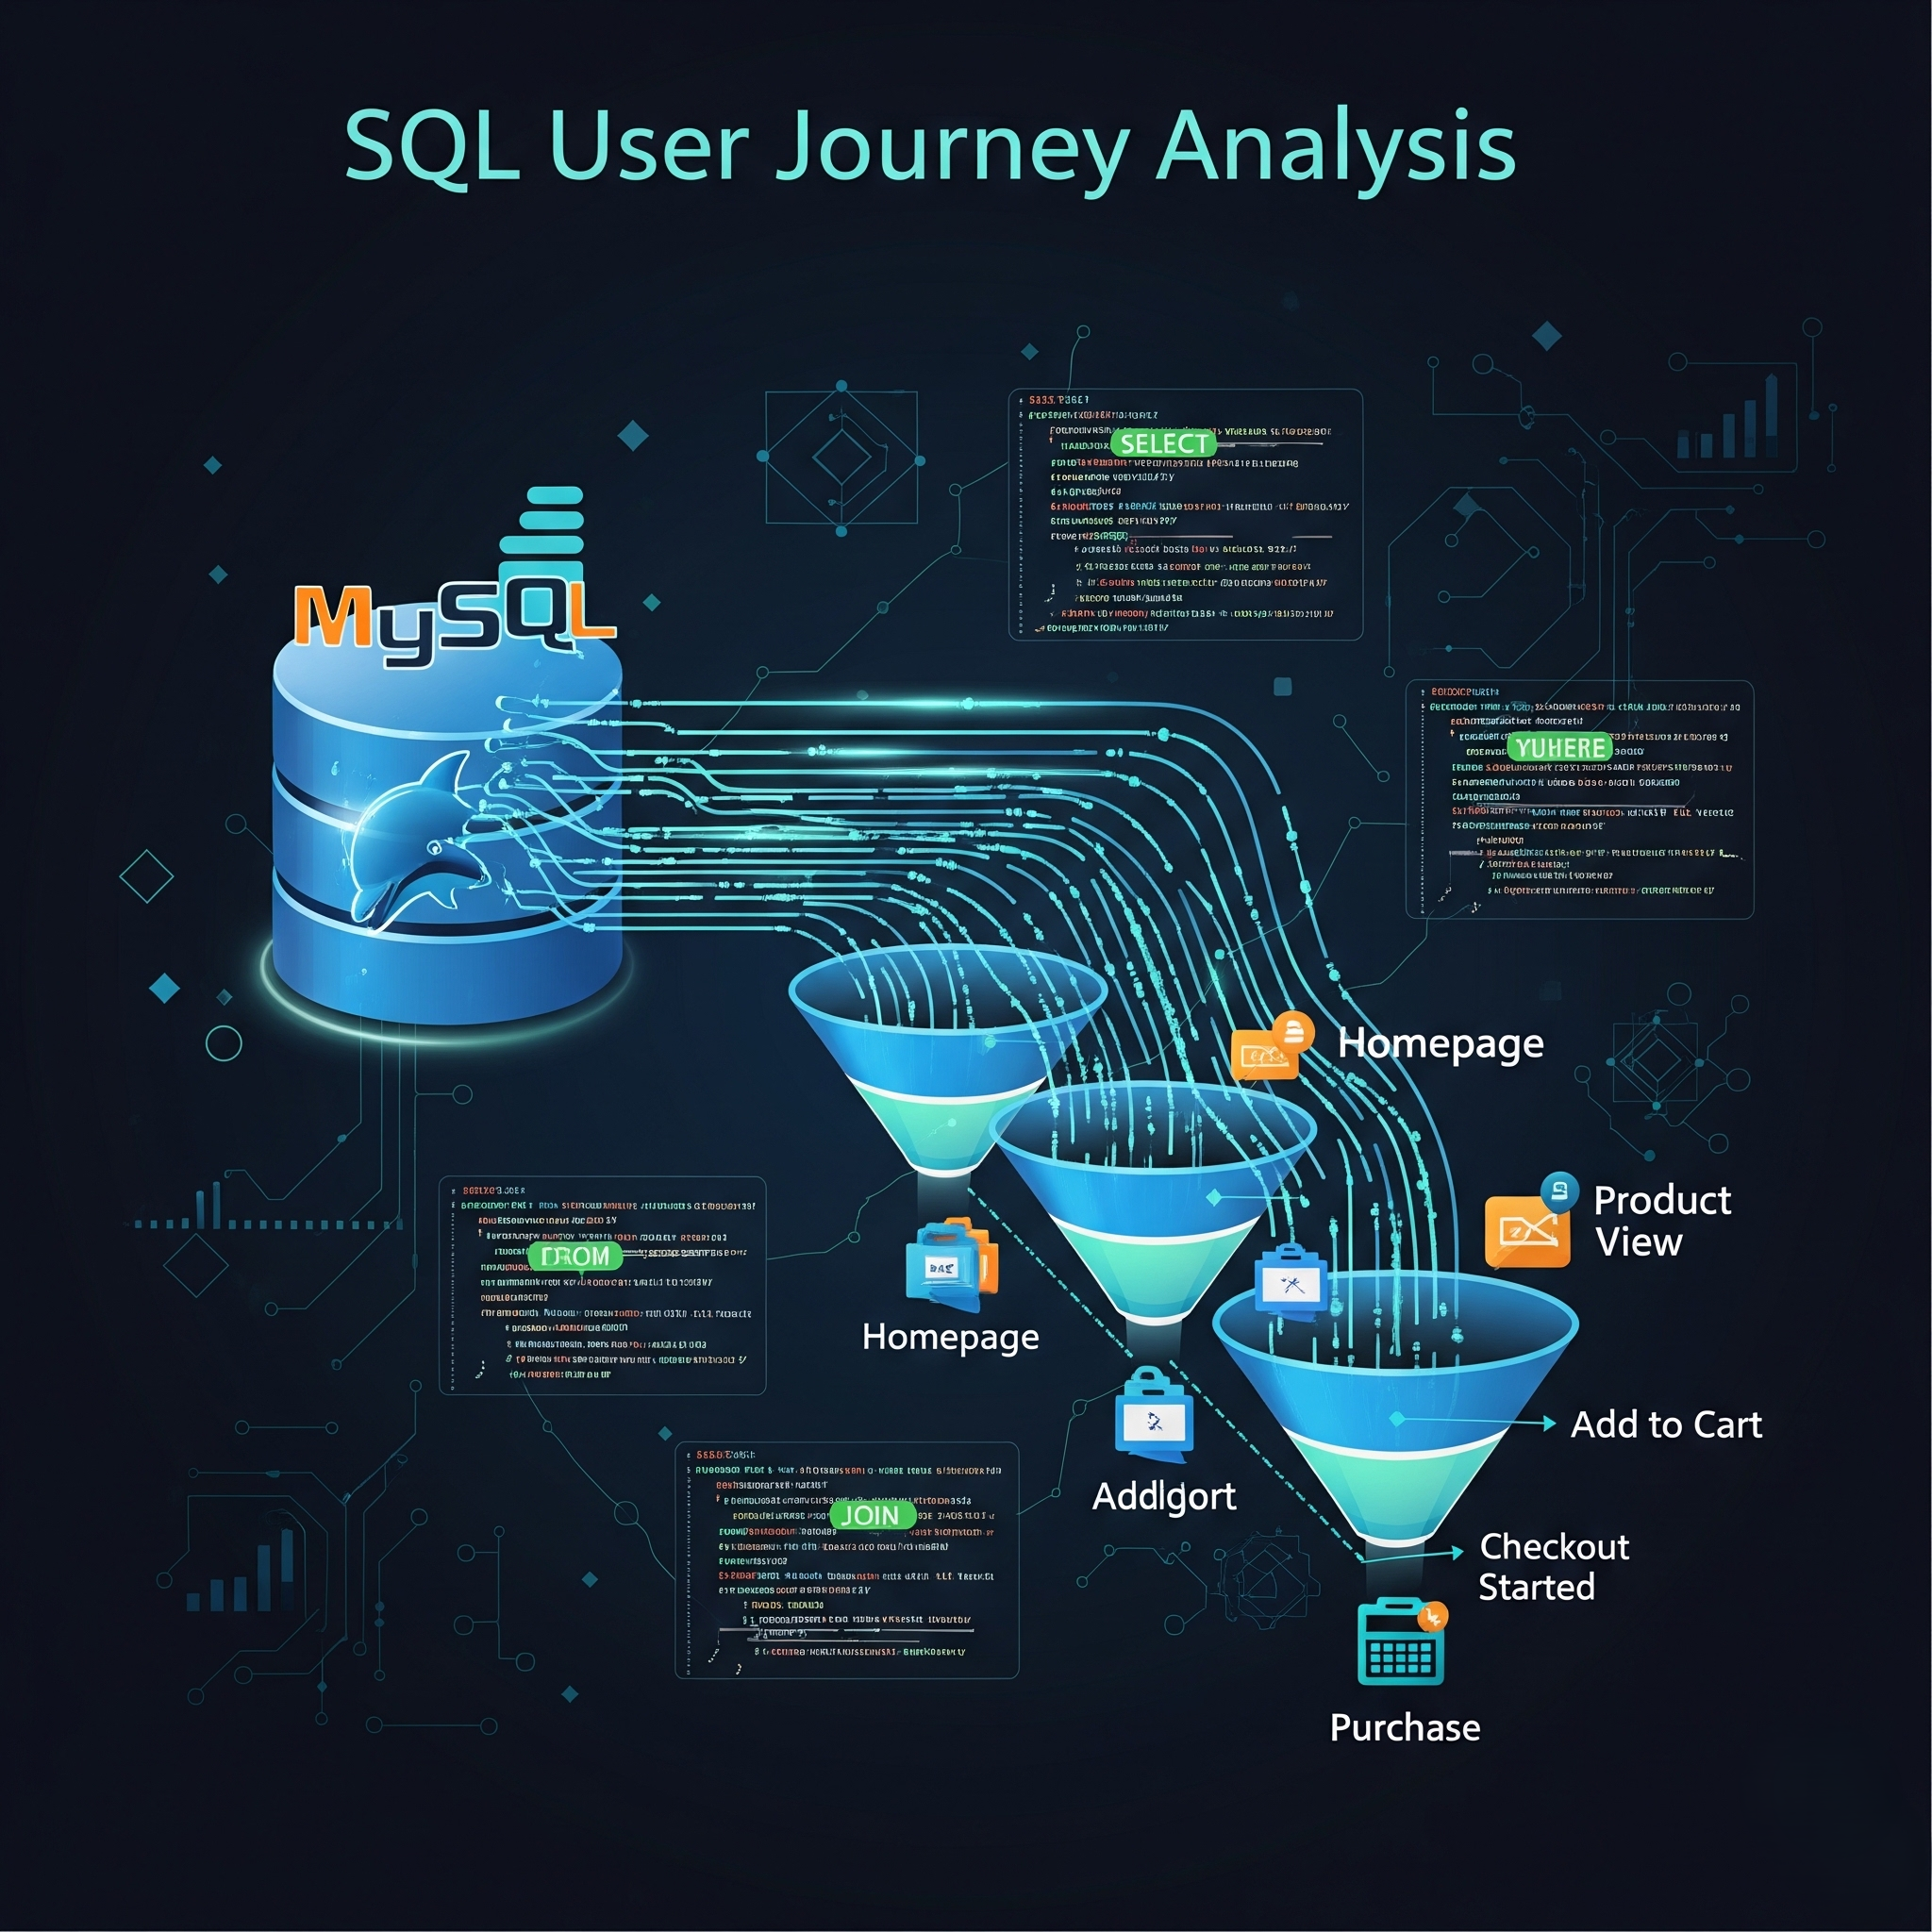
SQL User Journey Analysis
An advanced MySQL project extracting and concatenating website user journeys for paying customers to analyze conversion funnels. Built using CTEs, Window Functions, and GROUP_CONCAT.
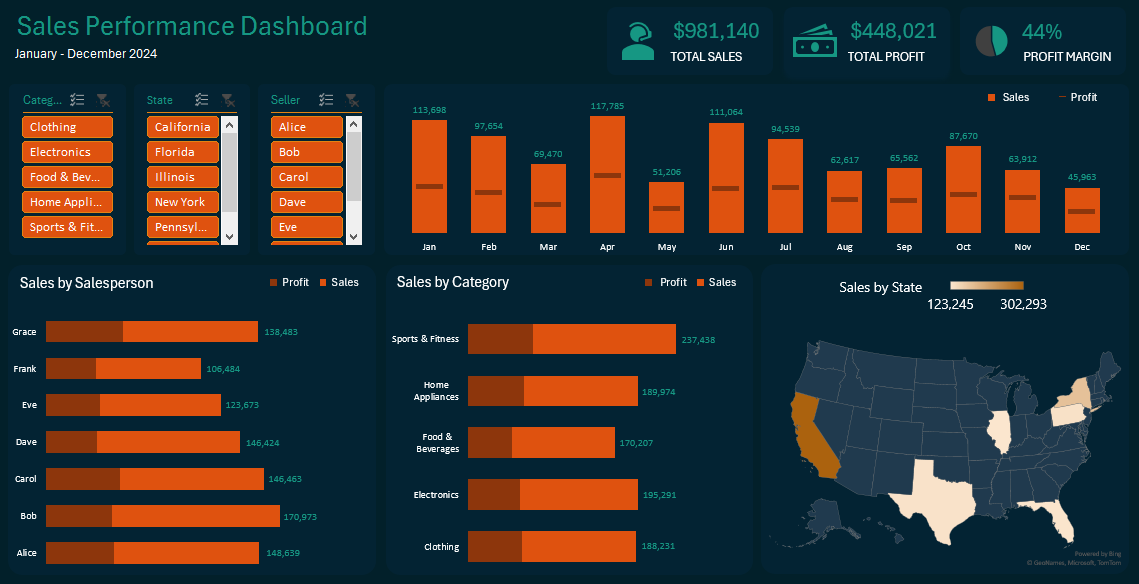
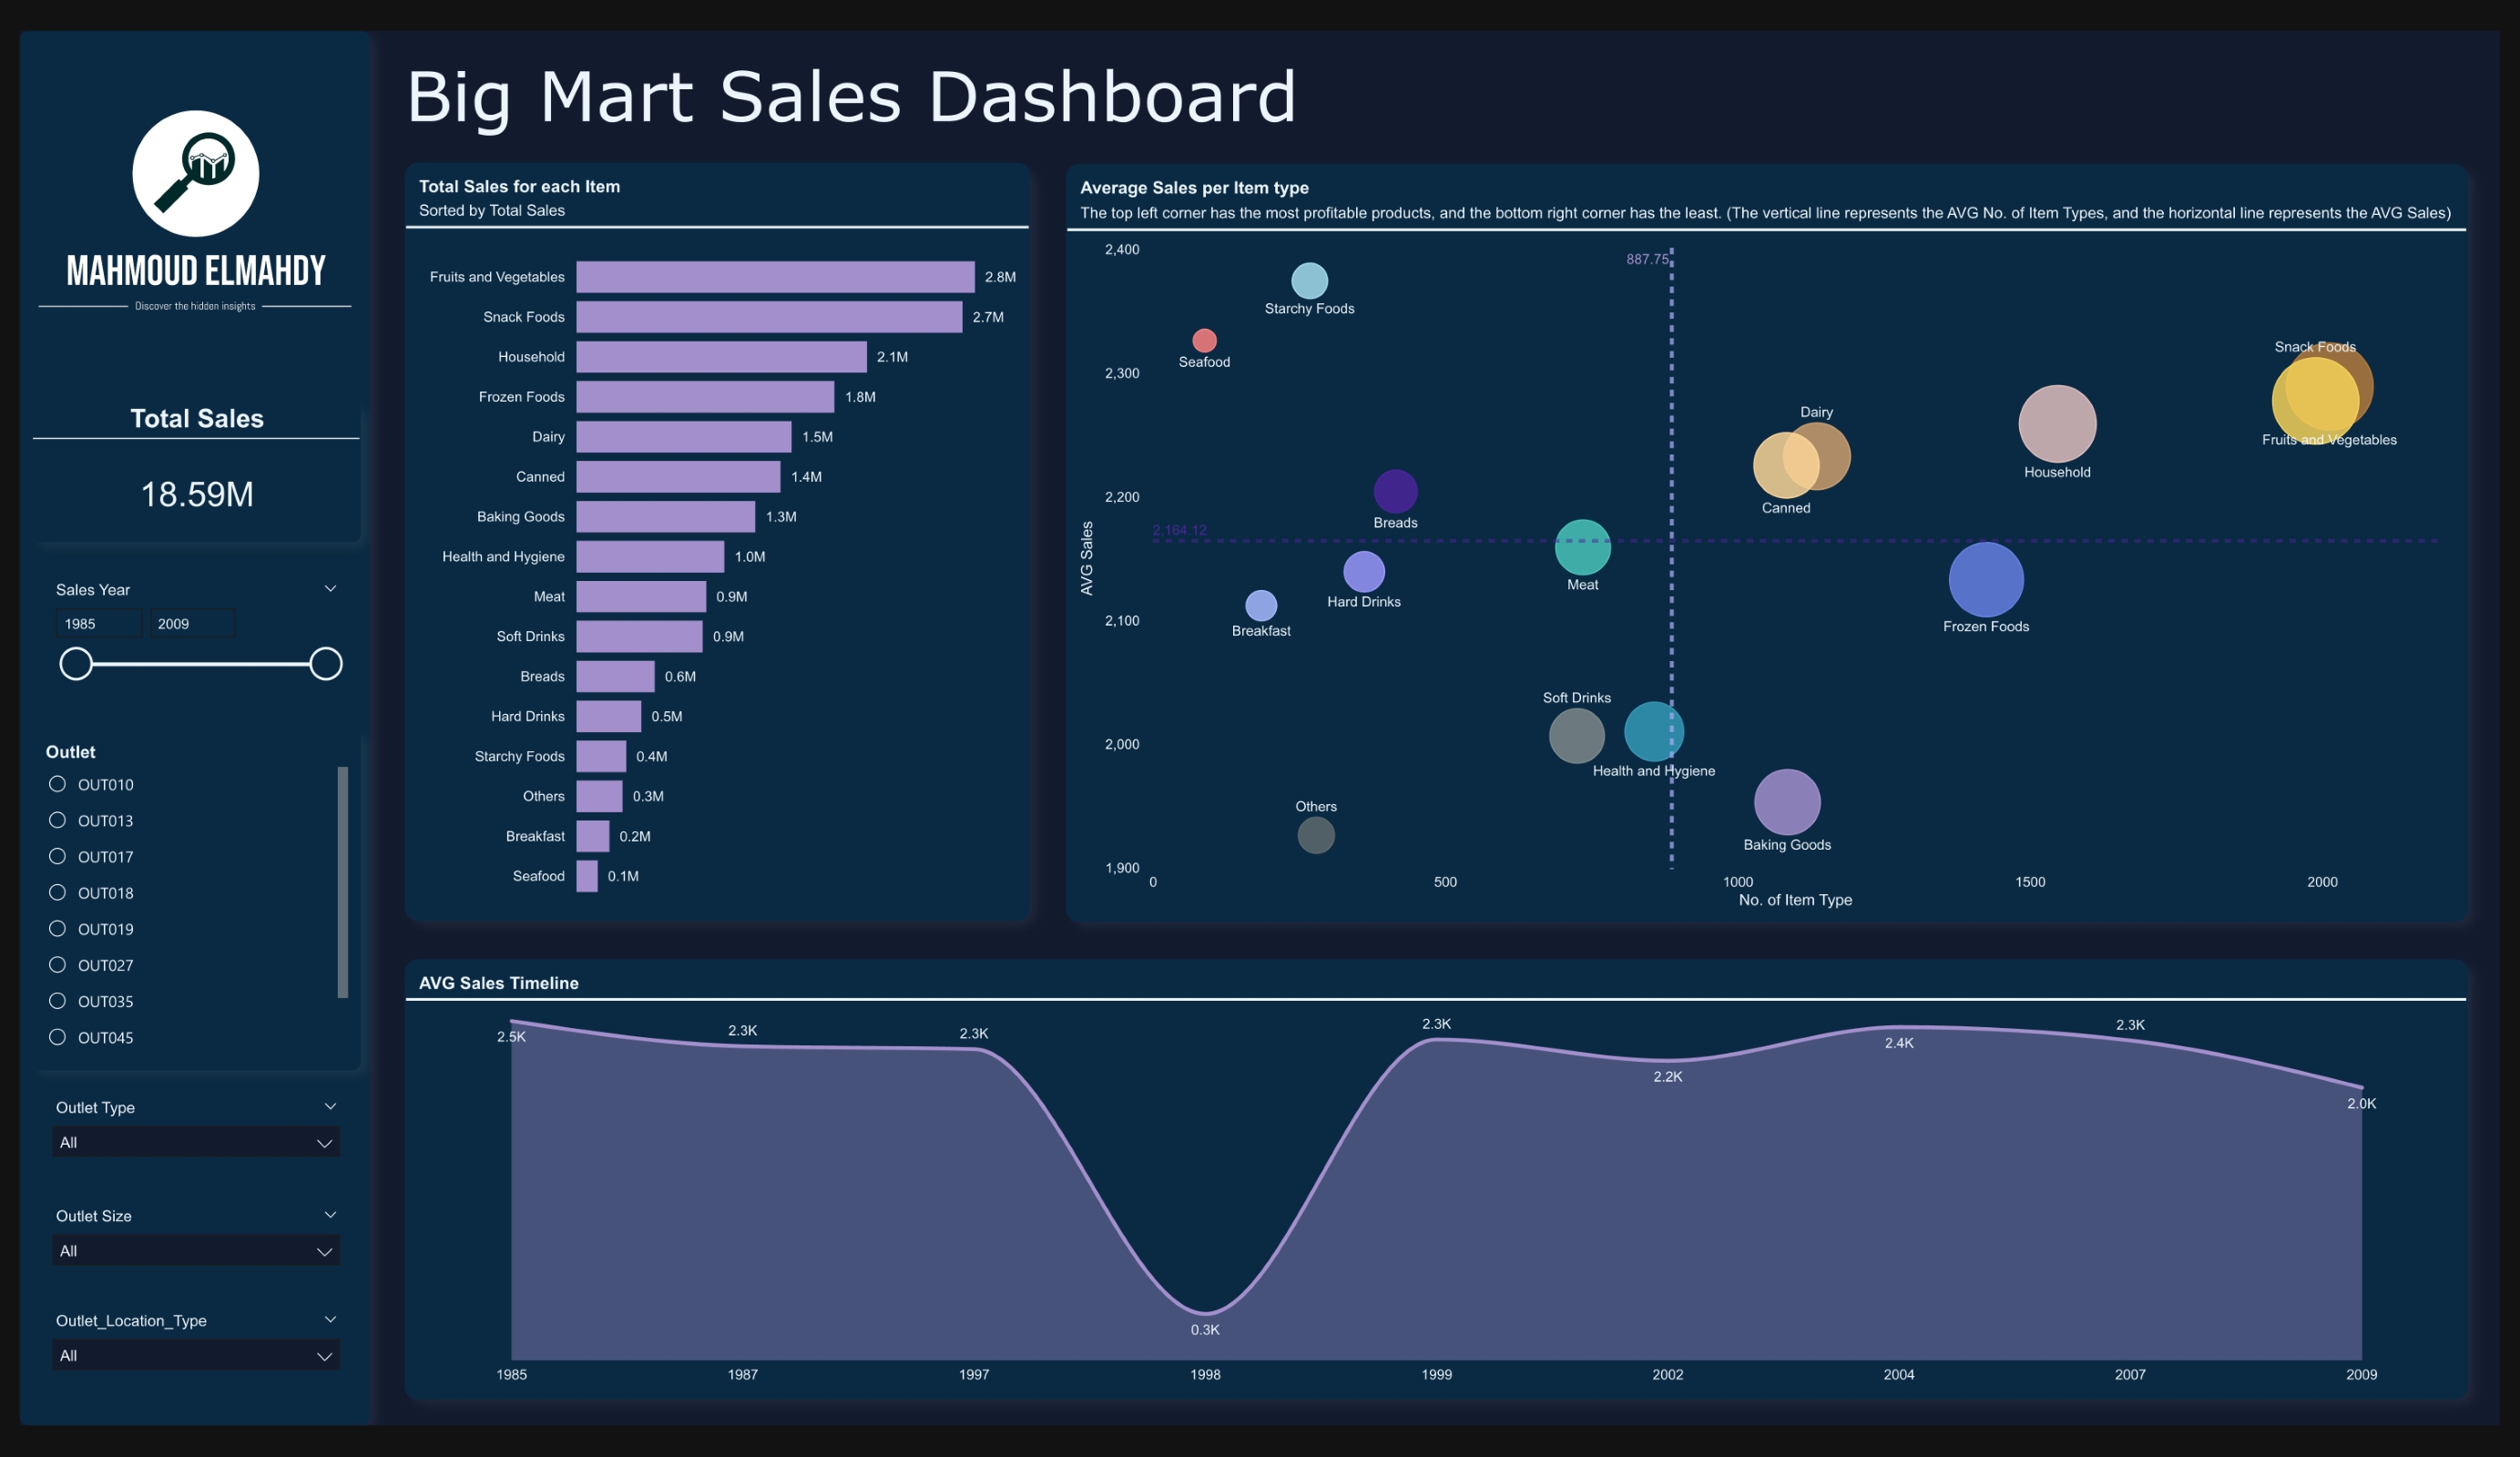
Comprehensive Sales & Profitability Tracker
An enterprise-grade Excel dashboard tracking nearly $1M in sales across multiple US states, categories, and salespersons. Features interactive slicers, Excel Map Charts for geographical sales density, and a modern dark-themed UI rivaling standalone BI tools.
/1.png)
Interactive Personal Finance & Budget Tracker (Bilingual)
A fully customized, bilingual (French/English) personal finance management tool in Excel for an Algerian client. Features automated transaction categorization, dynamic dashboards for spending habits and budget limits, and alerts when expenses exceed predefined thresholds.
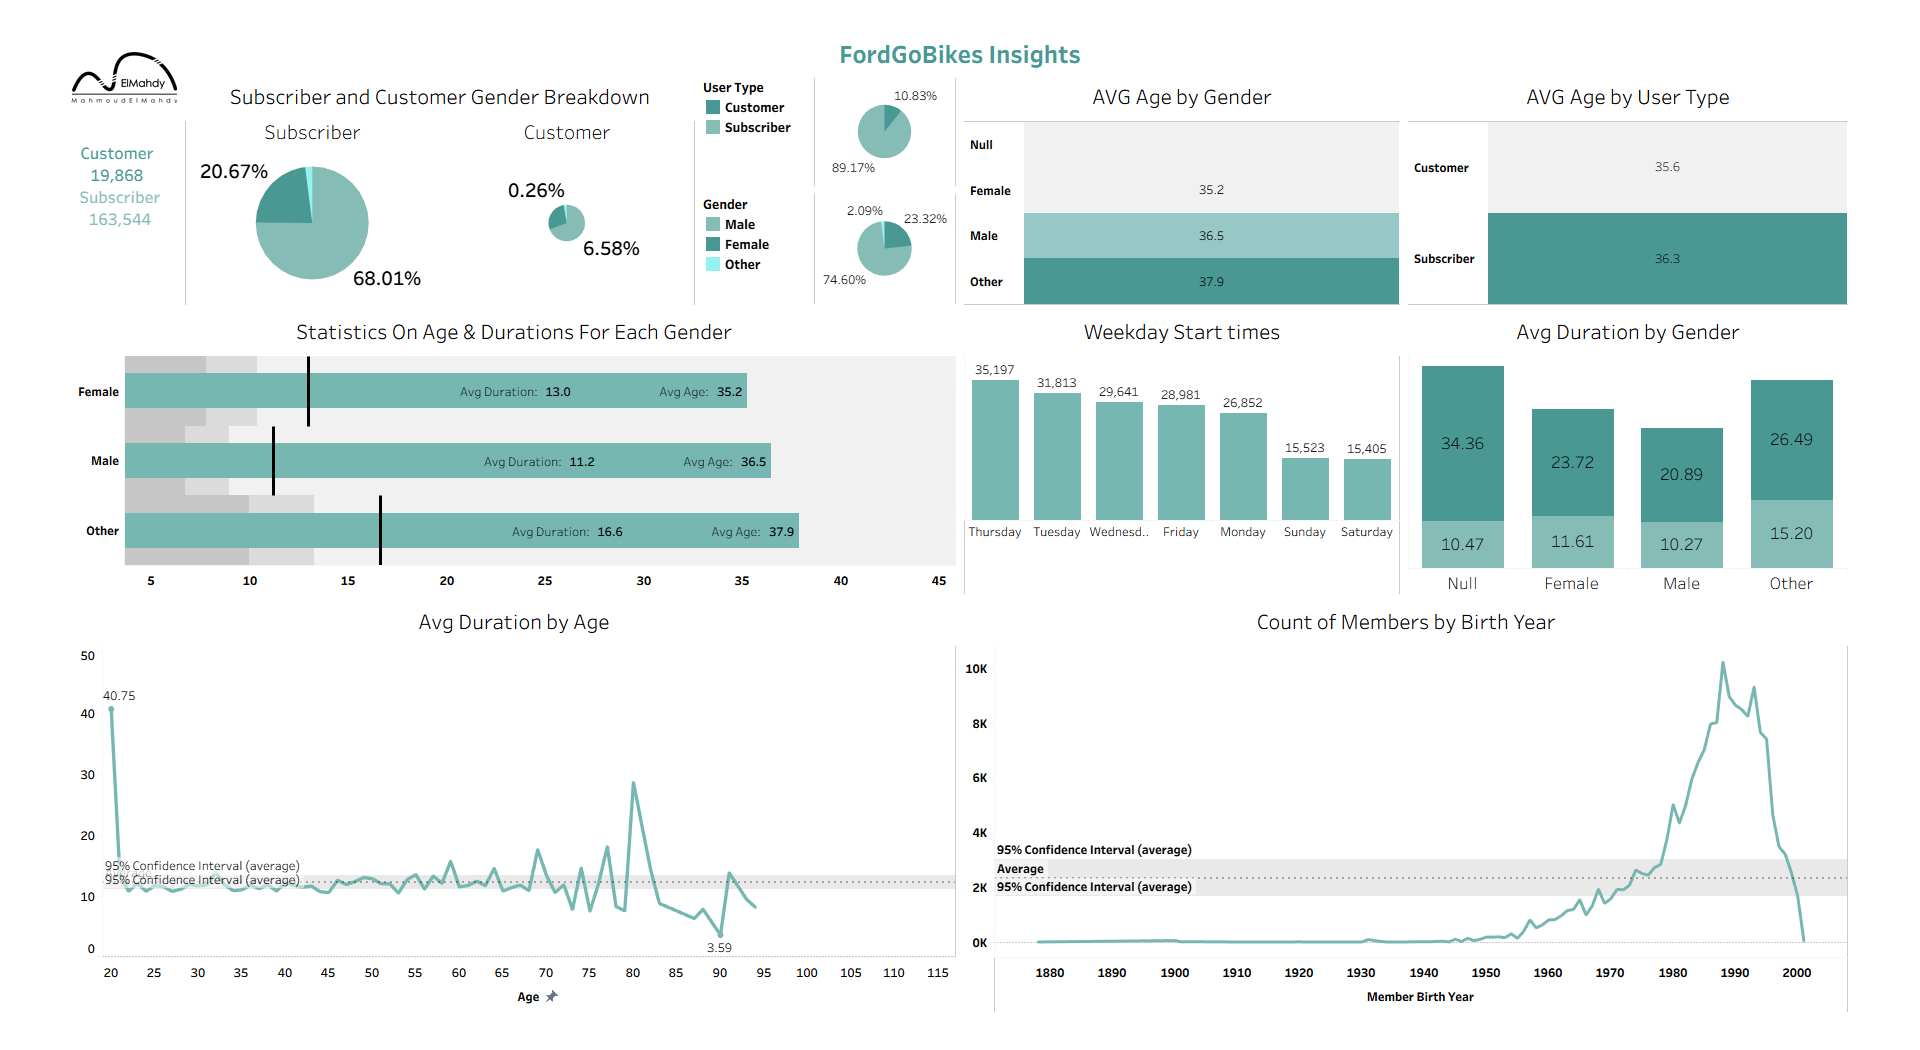
FordGoBikes Bike-Share Usage Analytics
A multi-dashboard Tableau project analyzing San Francisco's Ford GoBike trip data — uncovering rider demographics, peak usage patterns by weekday, trip duration trends by age and gender, and ranking the top and bottom stations by trip volume with an interactive geospatial map.